The cost of developing new upstream oil projects continues to rise due to ongoing inflationary pressures and persistent supply chain issues. According to new research from Rystad Energy, the average breakeven cost of a non-OPEC oil project has reached $47 per barrel of Brent crude, marking a 5% increase over the past year alone. Despite this rise, breakeven costs remain below current oil prices.
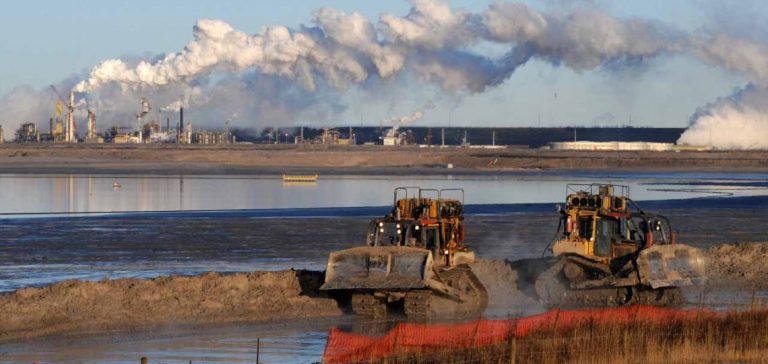
Offshore deepwater and shale projects remain the most economical sources of supply, while oil sands remain the most expensive. By analyzing breakeven costs, it is possible to estimate the amount of crude oil that will be delivered in the future based on the economic viability of different supply sources. The new research suggests that, despite rising costs, an increase in supply is likely by 2030, primarily driven by production from OPEC countries, where costs are low and resource potential is high.
Evolution of Breakeven Costs
The new equilibrium oil price for a demand of 105 million barrels per day in 2030 is estimated to be around $55 per barrel. The research includes a detailed global cost-of-supply analysis for remaining liquid resources, divided into producing and non-producing fields. The non-producing fields are further divided into different supply segment groups. The report found that onshore Middle East is the cheapest source of new production, with an average breakeven price of just $27 per barrel. This segment also boasts significant resource potential.
Production Segments and Economic Viability
The offshore shelf segment follows with a cost of $37 per barrel, then offshore deepwater at $43 and North American shale at $45. Conversely, oil sands breakeven costs average $57 per barrel, reaching up to approximately $75 per barrel. The rise in breakeven prices reflects increasing cost pressures in the upstream industry, posing challenges to the economic feasibility of some new projects.
Future Perspectives on Oil Supply
However, certain segments, notably offshore and shale, continue to offer competitive costs, ensuring that supply can still be maintained to meet future demand. Managing these cost increases will be crucial to sustaining long-term production growth.
Impact of Corporate Strategies on Supply
From 2014 to 2020, shale and OPEC were the clear winners, with each segment reducing its breakeven price and increasing potential volumes. Since 2020, the potential supply from shale has decreased, and shale production is now expected to reach around 22 million barrels per day by 2030, including natural gas liquids (NGL). This reduction is due to a shift in company strategy, with more cash being paid out to investors and industry consolidation.
CO₂ Emissions Analysis
Beyond breakevens, the average payback period for new projects, internal rate of return (IRR), and carbon dioxide (CO₂) intensity are vital metrics for evaluating the economics of oil development. The shale sector has a payback period of just two years, assuming an average oil price of $70 per barrel, demonstrating how quickly operators recover their investments. In contrast, the payback period is close to 10 years or more for other supply segments.
Shale also leads in terms of IRR, with an estimated IRR of around 35% in the same average oil price scenario. Conversely, oil sands, the most expensive supply source, have the lowest IRR at approximately 12%.
Environmental Considerations
Over the past three years, the average CO₂ intensity for shale has been 14 kilograms per barrel of oil equivalent (kg per boe), while offshore deepwater has a slightly higher average CO₂ intensity of 15 kg per boe. The oil sands sector remains behind other segments, with future estimated emissions around 70 kg per boe.


